1
/
of
1
store-traders-com
V. 21:8 (78-85): Interview: Chart Patterns, Trading, and Dan Zanger by Matt Blackman
V. 21:8 (78-85): Interview: Chart Patterns, Trading, and Dan Zanger by Matt Blackman
Regular price
$3.95 USD
Regular price
Sale price
$3.95 USD
Quantity
Couldn't load pickup availability
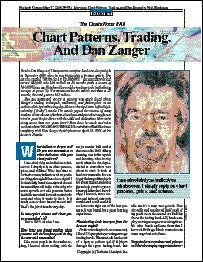
Interview: Chart Patterns, Trading, and Dan Zanger by Matt Blackman
Trader Dan Zanger of Chartpattern.com first hit the media spotlight in December 2000 when he was featured in a Fortune article. The article, entitled My Stocks Are Up 10,000%! discussed how he had turned $11,000 into $18 million in 18 months (with a return of 164,000%), an unofficial world record for trading stocks (with the tax receipts to prove it). Not mentioned in the article was that in 23 months, the total grew to $42 million.
Also not mentioned except in passing was much detail about Zangers trading techniques, indicators, and philosophies or an outline of his typical trading day. He uses chart patterns to find highvolatility (frisky) stocks. The article piqued the interest of many readers about the art of technical analysis and provided insight into what is possible for those with the skill and dedication. How is he doing more than two years later? How does he trade and what motivates him? STOCKS & COMMODITIES contributor Matt Blackman caught up with Dan Zanger by telephone on April 23, 2003, at his home in Florida.
What indicators do you use? Do you use momentum or other indicators with your chart patterns?
I use absolutely no indicators whatsoever. I simply rely on chart patterns, price, and volume. Who has time to look at so many indicators when youre scrolling through 400 stocks a night? I look at daily bars intensely and dissect them and then add in the volume bars to come up with sort of a pressure factor that tells me what the stock wants to do next and when it wants to do it. Is it ready now or does it need more time? Thats the job at hand every day.
You use price volume and chart patterns and thats it?
Thats 100% of what I use.
Trader Dan Zanger of Chartpattern.com first hit the media spotlight in December 2000 when he was featured in a Fortune article. The article, entitled My Stocks Are Up 10,000%! discussed how he had turned $11,000 into $18 million in 18 months (with a return of 164,000%), an unofficial world record for trading stocks (with the tax receipts to prove it). Not mentioned in the article was that in 23 months, the total grew to $42 million.
Also not mentioned except in passing was much detail about Zangers trading techniques, indicators, and philosophies or an outline of his typical trading day. He uses chart patterns to find highvolatility (frisky) stocks. The article piqued the interest of many readers about the art of technical analysis and provided insight into what is possible for those with the skill and dedication. How is he doing more than two years later? How does he trade and what motivates him? STOCKS & COMMODITIES contributor Matt Blackman caught up with Dan Zanger by telephone on April 23, 2003, at his home in Florida.
What indicators do you use? Do you use momentum or other indicators with your chart patterns?
I use absolutely no indicators whatsoever. I simply rely on chart patterns, price, and volume. Who has time to look at so many indicators when youre scrolling through 400 stocks a night? I look at daily bars intensely and dissect them and then add in the volume bars to come up with sort of a pressure factor that tells me what the stock wants to do next and when it wants to do it. Is it ready now or does it need more time? Thats the job at hand every day.
You use price volume and chart patterns and thats it?
Thats 100% of what I use.
Share