1
/
of
1
store-traders-com
V.9:2 (93-93): Average Behavior by John Sweeney
V.9:2 (93-93): Average Behavior by John Sweeney
Regular price
$2.95 USD
Regular price
Sale price
$2.95 USD
Quantity
Couldn't load pickup availability
Average Behavior
by John Sweeney
Let me speculate a little here. I know from experience that the half-cycle moving average generally runs along the tops of declining trends and along the bottoms of rising trends at least in the financials I follow. This behavior makes it possible to identify rich sells in declines and cheap buys in advances. But why does the average behave this way?
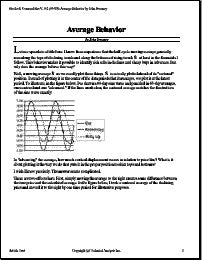
Well, a moving average as we usually plot these things is actually plotted ahead of its "centered" position. Instead of plotting it in the center of the data periods that it averages, we plot it at the latest period. To illustrate, in the figure below, I've drawn a 90-day sine wave and penciled in 45-day averages, one centered and one "advanced." If the lines aren't clear, the centered average matches the fluctuations of the sine wave exactly.
Let me speculate a little here. I know from experience that the half-cycle moving average generally runs along the tops of declining trends and along the bottoms of rising trends at least in the financials I follow. This behavior makes it possible to identify rich sells in declines and cheap buys in advances. But why does the average behave this way?
Well, a moving average as we usually plot these things is actually plotted ahead of its "centered" position. Instead of plotting it in the center of the data periods that it averages, we plot it at the latest period. To illustrate, in the figure below, I've drawn a 90-day sine wave and penciled in 45-day averages, one centered and one "advanced." If the lines aren't clear, the centered average matches the fluctuations of the sine wave exactly.
Share