1
/
of
1
store-traders-com
Stocks & Commodities V. 30:6 (56-59): Wealth-Lab Pro by Dennis D Peterson
Stocks & Commodities V. 30:6 (56-59): Wealth-Lab Pro by Dennis D Peterson
Regular price
$2.95 USD
Regular price
Sale price
$2.95 USD
Quantity
Couldn't load pickup availability
Wealth-Lab Pro by Dennis D Peterson
Wealth-Lab Pro is a complete trading platform that you can download on your computer. The product is aimed at programmers who want to program and backtest trading strategies for stocks or futures. It has a drag & drop feature that lets you build strategies with prebuilt indicators, but the greatest flexibility comes from using its programming language, Wealthscript.
When Wealth-Lab was initially developed, it was free via the Internet. It was quite a find: software that was well written in terms of navigation and capability, and you didnt have to pay through the nose for it. After a while, you did have to buy it, and then it was called Wealth-Lab Developer. A while after that, company cofounders Volker Knapp and designer/developer Dion Kurczek sold it to Fidelity Investments. Fidelity marketed the product as Wealth-Lab Pro and has made it available to US residents with a brokerage account with Fidelity Investments.
DATAFEEDS
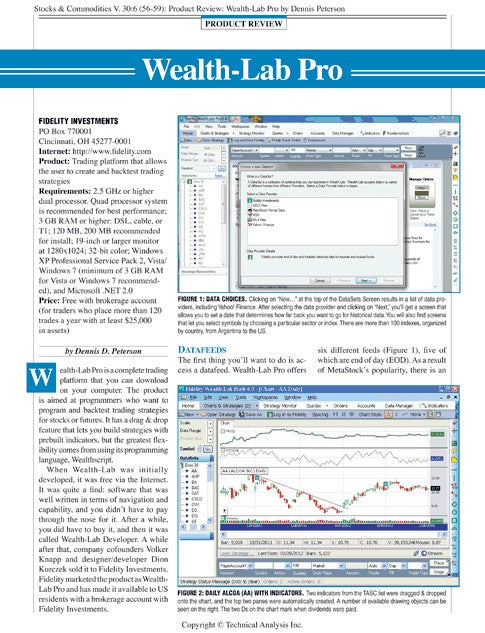
The first thing youll want to do is access a datafeed. Wealth-Lab Pro offers six different feeds (Figure 1), five of which are end of day (EOD). As a result of MetaStocks popularity, there is an interface to MetaStock formatted data. There are a couple of ways to get data into MetaStock format. Perhaps the easiest is to use CSI (Commodity Systems Inc.), which has a large number of leasing plans such as US stocks and indexes (with a 10-year history) for $285 a year. Or you could use Yahoo! Finance data, which is free EOD data.
CHARTING
Wealth-Lab Pro charts display price data in the usual formats candlesticks, line, and OHLC, to name a few but also in relatively rare formats such as equivolume, equicandle, kagi, point & figure, and renko, which is similar to point & figure. Renko creates boxes only when there is sufficient price movement, but uses only closing prices. The two classes of indicators to chart are TASC (as in Technical Analysis of Stocks & Commodities) indicators and Wealth-Lab standard indicators.
Wealth-Lab Pro is a complete trading platform that you can download on your computer. The product is aimed at programmers who want to program and backtest trading strategies for stocks or futures. It has a drag & drop feature that lets you build strategies with prebuilt indicators, but the greatest flexibility comes from using its programming language, Wealthscript.
When Wealth-Lab was initially developed, it was free via the Internet. It was quite a find: software that was well written in terms of navigation and capability, and you didnt have to pay through the nose for it. After a while, you did have to buy it, and then it was called Wealth-Lab Developer. A while after that, company cofounders Volker Knapp and designer/developer Dion Kurczek sold it to Fidelity Investments. Fidelity marketed the product as Wealth-Lab Pro and has made it available to US residents with a brokerage account with Fidelity Investments.
DATAFEEDS
The first thing youll want to do is access a datafeed. Wealth-Lab Pro offers six different feeds (Figure 1), five of which are end of day (EOD). As a result of MetaStocks popularity, there is an interface to MetaStock formatted data. There are a couple of ways to get data into MetaStock format. Perhaps the easiest is to use CSI (Commodity Systems Inc.), which has a large number of leasing plans such as US stocks and indexes (with a 10-year history) for $285 a year. Or you could use Yahoo! Finance data, which is free EOD data.
CHARTING
Wealth-Lab Pro charts display price data in the usual formats candlesticks, line, and OHLC, to name a few but also in relatively rare formats such as equivolume, equicandle, kagi, point & figure, and renko, which is similar to point & figure. Renko creates boxes only when there is sufficient price movement, but uses only closing prices. The two classes of indicators to chart are TASC (as in Technical Analysis of Stocks & Commodities) indicators and Wealth-Lab standard indicators.
Share