1
/
of
1
store-traders-com
Stocks & Commodities V. 28:9 (22-26): Cloudbanks by Thomas N Bulkowski
Stocks & Commodities V. 28:9 (22-26): Cloudbanks by Thomas N Bulkowski
Regular price
$2.95 USD
Regular price
Sale price
$2.95 USD
Quantity
Couldn't load pickup availability
Cloudbanks by Thomas N Bulkowski
Want to double your money? Invest in cloudbank chart patterns and you just might.
During the 30 years I have spent investing in or trading the markets, I have discovered many chart patterns, including pipes, horns, and barrs. Heres another, which I call the cloudbank pattern. Investing in cloudbanks gives you the opportunity to make a lot of money if you are patient and price rises back into the clouds.
IDENTIFICATION GUIDELINES
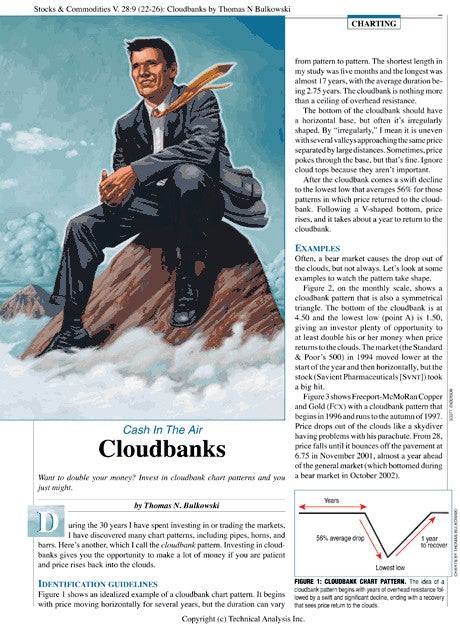
Figure 1 shows an idealized example of a cloudbank chart pattern. It begins with price moving horizontally for several years, but the duration can vary from pattern to pattern. The shortest length in my study was five months and the longest was almost 17 years, with the average duration being 2.75 years. The cloudbank is nothing more than a ceiling of overhead resistance.
The bottom of the cloudbank should have a horizontal base, but often its irregularly shaped. By irregularly, I mean it is uneven with several valleys approaching the same price separated by large distances. Sometimes, price pokes through the base, but thats fine. Ignore cloud tops because they arent important.
After the cloudbank comes a swift decline to the lowest low that averages 56% for those patterns in which price returned to the cloudbank. Following a V-shaped bottom, price rises, and it takes about a year to return to the cloudbank.
EXAMPLES
Often, a bear market causes the drop out of the clouds, but not always. Lets look at some examples to watch the pattern take shape.
Want to double your money? Invest in cloudbank chart patterns and you just might.
During the 30 years I have spent investing in or trading the markets, I have discovered many chart patterns, including pipes, horns, and barrs. Heres another, which I call the cloudbank pattern. Investing in cloudbanks gives you the opportunity to make a lot of money if you are patient and price rises back into the clouds.
IDENTIFICATION GUIDELINES
Figure 1 shows an idealized example of a cloudbank chart pattern. It begins with price moving horizontally for several years, but the duration can vary from pattern to pattern. The shortest length in my study was five months and the longest was almost 17 years, with the average duration being 2.75 years. The cloudbank is nothing more than a ceiling of overhead resistance.
The bottom of the cloudbank should have a horizontal base, but often its irregularly shaped. By irregularly, I mean it is uneven with several valleys approaching the same price separated by large distances. Sometimes, price pokes through the base, but thats fine. Ignore cloud tops because they arent important.
After the cloudbank comes a swift decline to the lowest low that averages 56% for those patterns in which price returned to the cloudbank. Following a V-shaped bottom, price rises, and it takes about a year to return to the cloudbank.
EXAMPLES
Often, a bear market causes the drop out of the clouds, but not always. Lets look at some examples to watch the pattern take shape.
Share