1
/
of
1
store-traders-com
Stocks & Commodities V. 24:3 (92): Websites For Traders: TraderMike.net by Jayanthi Gopalakrishnan
Stocks & Commodities V. 24:3 (92): Websites For Traders: TraderMike.net by Jayanthi Gopalakrishnan
Regular price
$2.95 USD
Regular price
Sale price
$2.95 USD
Quantity
Couldn't load pickup availability
Stocks & Commodities V. 24:3 (92): Websites For Traders: TraderMike.net by Jayanthi Gopalakrishnan
WWW.TRADERMIKE.NET
At a time when reading weblogs is fast becoming a ritual, its no surprise that the number of technical analysis blogs is on the rise. One that I read regularly is www.TraderMike.net. Once you visit the site youll understand why. Its interactive, as are most blogs, with clearly explained charts, which make it very easy to understand the reasoning behind the bloggers opinions.
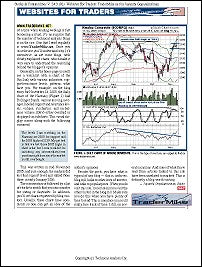
Generally, on the home page you will see a watchlist with a chart of the NASDAQ with various indicators, support/resistance levels, patterns, what have you. For example, on the blog entry for November 14, 2005, the daily chart of the NASDAQ (Figure 1) had Bollinger Bands, various moving averages, labeled support and resistance levels, volume, stochastics, and on-balance volume (OBV) either overlaid or displayed on subcharts.
WWW.TRADERMIKE.NET
At a time when reading weblogs is fast becoming a ritual, its no surprise that the number of technical analysis blogs is on the rise. One that I read regularly is www.TraderMike.net. Once you visit the site youll understand why. Its interactive, as are most blogs, with clearly explained charts, which make it very easy to understand the reasoning behind the bloggers opinions.
Generally, on the home page you will see a watchlist with a chart of the NASDAQ with various indicators, support/resistance levels, patterns, what have you. For example, on the blog entry for November 14, 2005, the daily chart of the NASDAQ (Figure 1) had Bollinger Bands, various moving averages, labeled support and resistance levels, volume, stochastics, and on-balance volume (OBV) either overlaid or displayed on subcharts.
Share