1
/
of
1
store-traders-com
Stocks & Commodities V. 21:3 (100-109): Traders' Tips by Technical Analysis, Inc.
Stocks & Commodities V. 21:3 (100-109): Traders' Tips by Technical Analysis, Inc.
Regular price
$4.95 USD
Regular price
Sale price
$4.95 USD
Quantity
Couldn't load pickup availability
Traders Tips by Technical Analysis, Inc.
TRADESTATION: FIBONACCI RETRACEMENTS AND THE RSI
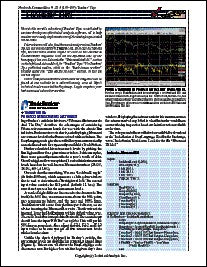
Ingo Buchers article in this issue, Fibonacci Retracements And The RSI, describes the advantages of considering Fibonacci retracement levels for use with the classic RSI indicator. Bucher reviews six charts, each displaying Fibonacci retracement levels for the RSI associated with each chart. The EasyLanguage code given here will allow you to automatically recreate these charts for any security available in TradeStation.
Bucher calculated his retracement levels by picking the RSI high and low for a given time window. In his examples, these were generally six months to a years worth of data. Once the high and low were picked, he calculated retracement levels based on the well-known Fibonacci numbers (23.6%, 38.2%, 50%, 61.8%).
TRADESTATION: FIBONACCI RETRACEMENTS AND THE RSI
Ingo Buchers article in this issue, Fibonacci Retracements And The RSI, describes the advantages of considering Fibonacci retracement levels for use with the classic RSI indicator. Bucher reviews six charts, each displaying Fibonacci retracement levels for the RSI associated with each chart. The EasyLanguage code given here will allow you to automatically recreate these charts for any security available in TradeStation.
Bucher calculated his retracement levels by picking the RSI high and low for a given time window. In his examples, these were generally six months to a years worth of data. Once the high and low were picked, he calculated retracement levels based on the well-known Fibonacci numbers (23.6%, 38.2%, 50%, 61.8%).
Share